Thursday 23 August 2012
What is Power Factor?
What is Power Factor?
Super. I’m ready to find out what power factor is.
To understand power factor, we’ll first start with the definition of some basic terms:
KW is Working Power (also called Actual Power or Active Power or Real Power).
It is the power that actually powers the equipment and performs useful
work.
KVAR is Reactive Power.
It is the power that magnetic equipment (transformer, motor and relay)
needs to produce the magnetizing flux.
KVA is Apparent Power.
It is the “vectorial summation” of KVAR and KW.
Let’s look at a simple analogy in order to better understand these terms….
Let’s say you are at the ballpark and it is a really hot day. You order up a
mug of your favorite brewsky. The thirst-quenching portion of your beer
is represented by KW (Figure 1).
Unfortunately, life isn’t perfect. Along with your ale comes a little bit of
foam. (And let’s face it…that foam just doesn’t quench your thirst.) This
foam is represented by KVAR.
The total contents of your mug, KVA, is this summation of KW (the beer)
and KVAR (the foam).
Figure 1
So, now that we understand some basic terms, we are ready to learn about power factor:
Power Factor (P.F.) is the ratio of Working Power to Apparent Power.
Looking at our beer mug analogy above, power factor would be the ratio
of beer (KW) to beer plus foam (KVA).
P.F. = KW
KW + KVAR
. = Beer
Beer + Foam
P.F. = KW
KVA
Thus, for a given KVA:
• The more foam you have (the higher the percentage of
KVAR), the lower your ratio of KW (beer) to KVA (beer
plus foam). Thus, the lower your power factor.
• The less foam you have (the lower the percentage of
KVAR), the higher your ratio of KW (beer) to KVA (beer
plus foam). In fact, as your foam (or KVAR) approaches
zero, your power factor approaches 1.0.
Our beer mug analogy is a bit simplistic. In reality, when we calculate
KVA, we must determine the “vectorial summation” of KVAR and KW.
Therefore, we must go one step further and look at the angle between
these vectors.


Capacitive Run
Single Phase AC Induction Motors
AC single phase induction motors are classified by their start and run characteristics. An auxiliary starter winding is placed at right angles to the main stator winding in order to create a magnetic field. The current moving through each winding is out of phase by 90 degrees. This is called phase differential. After the motor has reached approximately 75% of operating speed, the auxiliary winding is disconnected from the circuit by a centrifugal switch.

AC single phase induction motors are classified by their start and run characteristics. An auxiliary starter winding is placed at right angles to the main stator winding in order to create a magnetic field. The current moving through each winding is out of phase by 90 degrees. This is called phase differential. After the motor has reached approximately 75% of operating speed, the auxiliary winding is disconnected from the circuit by a centrifugal switch.

Losses in Induction Motor
A. Definition of energy efficiency
Efficiency is the ratio of mechanical energy output divided by
the electrical energy input. There are different efficiency definitions
that describe the relationship between a motor’s rating and
efficiency test results:
- Tested. This refers to the efficiency measured by testing that
specific motor.
- Nominal or Average Expected. Nominal values are the average
values obtained after testing a sample population of the motor model.
- Nameplate. This refers to the efficiency measured by a specific
standard.
- Minimum. These values are intended to represent the lowest point in
the bell curve of motor efficiency distribution.
- Apparent Efficiency. This is the product of a motor’s efficiency and
power factor.

Figure 2.1 – Typical energy flow of standard motors
B. Motor Losses
Energy losses are the determining factor in motor
efficiency. These losses can be divided in five classes:
Classes of Motor Energy Losses
B. Motor Losses
Energy losses are the determining factor in motor
efficiency. These losses can be divided in five classes:
Classes of Motor Energy Losses

The main difference between the standards emerges
from the way in which the additional load losses, is
treated. The IEC 34.2 standard assumes a standard value
for the additional load losses at rated load of 0.5% of the
input power. The new proposed IEC 61972 standard
gives two possibilities for the assessment of the
additional losses. The first one is a determination by
means of the measured output power, as in the IEEE 112-
B; the second one gives a fixed amount to every machine
of the same rated power. The Japanese JEC standard 37
completely neglects the additional load losses.
Wednesday 22 August 2012
Starting methods of Induction Motor
Introduction
Most large induction motors are started directly on line, but when very large motors are started that way, they cause a disturbance of voltage on the supply lines due to large starting current surges. To limit the starting current surge, large induction motors are started at reduced voltage and then have full supply voltage reconnected when they run up to near rotated speed.
Two methods of reduced voltage starting are star delta starting and autotransformer stating. Contactors perform the switching action in the starter to connect and disconnect the power supply to the motor. If the current is above the rated current for the motor, the contactor will be tripped automatically to disconnect the motor from the supply.
A three phase supply is given to the stator of the three phase induction motor, and this in turn produces a magnetic field which revolves in space around the stator. As if the magnetic poles are being rotated, the speed of the rotating magnetic field is given by
N = 120 f /PStarting Principle
The high starting current will produce severe a voltage drop and will affect the operation of other equipment. It is not desirable to start large motors direct on line (giving full voltage to the stator). Normally with motors beyond 5 HP, starters are provided. For reduction in the starting current, a lower voltage is applied to the stator, especially for the squirrel cage induction motors. Full voltage is only applied when the motor picks up speed.
Starting methods of Induction motor include:
- Direct –On– line (DOL) starters for less than 10 Kw motors.
- Star–Delta starters for large motors. The stator winding is initially connected in a star configuration and later on changed over to a Delta connection, when the motor reaches rated speed.
- Auto transformer.
1. Direct On Line Starter
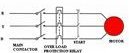
- It is simple and cheap starter for a 3-phase induction motor.
- The contacts close against spring action.
- This method is normally limited to smaller cage induction motors, because starting current can be as high as eight times the full load current of the motor. Use of a double –cage rotor requires lower staring current( approximately four times) and use of quick acting A.V.R enables motors of 75 Kw and above to be started direct on line.
- An isolator is required to isolate the starter from the supply for maintenance.
- Protection must be provided for the motor. Some of the safety protections are over-current protection, under-voltage protection, short circuit protection, etc. Control circuit voltage is sometimes stepped down through an autotransformer.
2. Star-Delta Starter
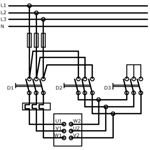
- A three phase motor will give three times the power output when the stator windings are connected in delta than if connected in star, but will take 1/3 of the current from the supply when connected in star than when connected in delta. The starting torque developed in star is ½ that when starting in delta.
- A two-position switch (manual or automatic) is provided through a timing relay.
- Starting in star reduces the starting current.
- When the motor has accelerated up to speed and the current is reduced to its normal value, the starter is moved to run position with the windings now connected in delta.
- More complicated than the DOL starter, a motor with a star-delta starter may not produce sufficient torque to start against full load, so output is reduced in the start position. The motors are thus normally started under a light load condition.
- Switching causes a transient current which may have peak values in excess of those with DOL.
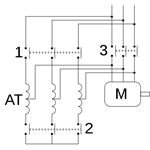
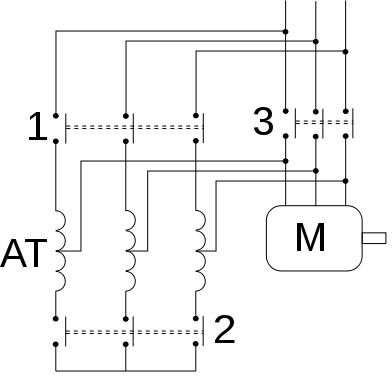
3. Auto Transformer Motor Starting
- Operated by a two position switch i.e. manually / automatically using a timer to change over from start to run position.
- In starting position supply is connected to stator windings through an auto-transformer which reduces applied voltage to 50, 60, and 70% of normal value depending on tapping used.
- Reduced voltage reduces current in motor windings with 50% tapping used motor current is halved and supply current will be half of the motor current. Thus starting current taken from supply will only be 25% of the taken by DOL starter.
- For an induction motor, torque T is developed by V2, thus on 50% tapping, torque at starting is only (0.5V)2 of the obtained by DOL starting. Hence 25% torque is produced.
- Starters used in lager industries, it is larger in size and expensive.
- Switching from start to run positions causing transient current, which can be greater in value than those obtained by DOL starting.
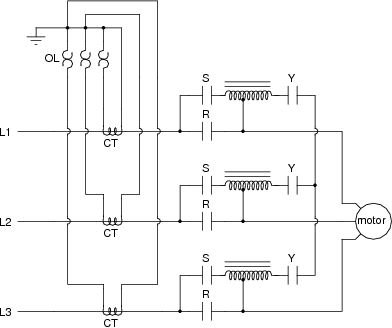
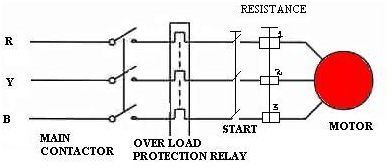
4. Rotor Resistance Starter
- This starter is used with a wound rotor induction motor. It uses an external resistance/phase in the rotor circuit so that rotor will develop a high value of torque.
- High torque is produced at low speeds, when the external resistance is at its higher value.
- At start, supply power is connected to stator through a three pole contactor and, at a same time, an external rotor resistance is added.
- The high resistance limits staring current and allows the motor to start safely against high load.
- Resistors are normally of the wire-wound type, connected through brushes and slip rings to each rotor phase. They are tapped with points brought out to fixed contactors.
- As the motor starts, the external rotor resistance is gradually cut out of circuit ; the handle or starter is turned and moves the three contacts simultaneously from one fixed contact to the next.
- The three moving contacts are interconnected to form a start point for the resistors.
- To ensure that the motor cannot be started until all rotor resistance is in circuit, an interlock is fitted which prevents the contactors from being closed until this condition is fulfilled.

Monday 20 August 2012
Winding failures in motor
Lovato motor protection relays
Winding failures in motor
The majority of winding failures in motor are either indirectlyor directly caused by overloading (either prolonged or cyclic), operation on unbalanced supply voltage, or single phasing, which all lead through excessive heating to the deterioration of the winding insulation until an electrical fault occurs.
The generally accepted rule is that insulation life is halved for each 10° C rise in temperature above the rated value, modified by the length of time spent at the higher temperature. As an electrical machine has a relatively large heat storage capacity, it follows that infrequent overloads of short duration may not adversely affect the machine.
However, sustained overloads of only a few percent may result in premature ageing and insulation failure. Furthermore, the thermal withstand capability of the motor is affected by heating in the winding prior to a fault.
It is therefore important that the relay characteristic takes account of the extremes of zero and full-load pre-fault current known respectively as the ‘Cold‘ and ‘Hot‘ conditions.
The variety of motor designs, diverse applications, variety of possible abnormal operating conditions and resulting modes of failure result in a complex thermal relationship.
A generic mathematical model that is accurate is therefore impossible to create. However, it is possible to develop an approximate model if it is assumed that the motor is a homogeneous body, creating and dissipating heat at a rate proportional to temperature rise.
This is the principle behind the ‘thermal replica’ model of a motor used for overload protection.
The temperature T at any instant is given by:
where:
Tmax = final steady state temperature
τ = heating time constant
Tmax = final steady state temperature
τ = heating time constant
Temperature rise is proportional to the current squared:
where:
IR = current which, if flowing continuously, produces temperature Tmax in the motor
IR = current which, if flowing continuously, produces temperature Tmax in the motor
Therefore, it can be shown that, for any overload current I, the permissible time t for this current to flow is:
In general, the supply to which a motor is connected may contain both positive and negative sequence components, and both components of current give rise to heating in the motor.
Therefore, the thermal replica should take into account both of these components, a typical equation for the equivalent current being:
where:
I1 = positive sequence current
I2 = negative sequence current
I1 = positive sequence current
I2 = negative sequence current
and
at rated speed. A typical value of K is 3.
Finally, the thermal replica model needs to take into account the fact that the motor will tend to cool down during periods of light load, and the initial state of the motor. The motor will have a cooling time constant τr, that defines the rate of cooling.
Hence, the final thermal model can be expressed as followin Equation 1:
where:
τ = heating time constant
k = Ieq / Ith
A2 = initial state of motor (cold or hot)
Ith =thermal setting current
k = Ieq / Ith
A2 = initial state of motor (cold or hot)
Ith =thermal setting current
Equation 1 takes into account the ‘cold’ and ‘hot’ characteristics defined in IEC 60255, part 8.
Some relays may use a dual slope characteristic for the heating time constant, and hence two values of the heating time constant are required. Switching between the two values takes place at a pre-defined motor current. This may be used to obtain better tripping performance during starting on motors that use a star-delta starter. During starting, the motor windings carry full line current, while in the ‘run’ condition, they carry only 57% of the current seen by the relay.
Similarly, when the motor is disconnected from the supply, the heating time constant τ is set equal to the cooling time constant τr.
Since the relay should ideally be matched to the protected motor and be capable of close sustained overload protection, a wide range of relay adjustment is desirable together with good accuracy and low thermal overshoot.
Typical relay setting curves are shown in Figure 1.
Figure 1: Thermal overload characteristic curves; Cold curves. Initial thermal state 0%
Resource: Network, Protection & Automation Guide – Areva
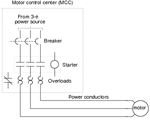
PLC and Ladder Diagrams
PLCs hardwired in panelboard (Curtesy of Richmond Engineering Works)
The ladder diagram has and continues to be the traditional way of representing electrical sequences of operations. These diagrams represent the interconnection of field devices in such a way that the activation, or turning ON, of one device will turn ON another device according to a predetermined sequence of events.
Figure 1 illustrates a simple electrical ladder diagram.
Figure 1 - Simple electrical ladder diagram
The original ladder diagrams were established to represent hardwired logic circuits used to control machines or equipment. Due to wide industry use, they became a standard way of communicating control information from the designers to the users of equipment. As programmable controllers were introduced, this type of circuit representation was also desirable because it was easy to use and interpret and was widely accepted in industry.
Programmable controllers can implement all of the “old” ladder diagram conditions and much more. Their purpose is to perform these control operations in a more reliable manner at a lower cost. A PLC implements, in its CPU, all of the old hardwired interconnections using its software instructions. This is accomplished using familiar ladder diagrams in a manner that is transparent to the engineer or programmer. Knowledge of PLC operation, scanning, and instruction programming is vital to the proper implementation of a control system.
Figure 2 illustrates the PLC transformation of the simple diagram shown in Figure 1 to a PLC format. Note that the “real” I/O field devices are connected to input and output interfaces, while the ladder program is implemented in a manner, similar to hardwiring, inside the programmable controller (i.e., softwired inside the PLC’s CPU instead of hardwired in a panel).
As previously mentioned, the CPU reads the status of inputs, energizes the corresponding circuit element according to the program, and controls a real output device via the output interfaces.
Figure 2 - PLC implementation of Figure 1
As you will see later, each instruction is represented inside the PLC by a reference address, an alphanumeric value by which each device is known in the PLC program. For example, the push button PB1 is represented inside the PLC by the name PB1 (indicated on top of the instruction symbol) and likewise for the other devices shown in Figure 2.
These instructions are represented here, for simplicity, with the same device and instruction names. Example 1-1 illustrates the similarity in operation between hardwired and PLC circuits.
Example 1
In the hardwired circuit shown in Figure 1, the pilot light PL will turn ON if the limit switch LS1 closes and if either push button PB1 or limit switch LS2 closes. In the PLC circuit, the same series of events will cause the pilot light—connected to an output module—to turn ON.
Note that in the PLC circuit in Figure 2, the internal representation of contacts provides the equivalent power logic as a hardwired circuit when the referenced input field device closes or is pushed. Sketch hardwired and PLC implementation diagrams for the circuit in Figure 1 illustrating the configurations of inputs that will turn PL ON.
Solution
Figure 3 shows several possible configurations for the circuit in Figure 1. The highlighted blue lines indicate that power is present at that connection point, which is also the way a programming or monitoring device represents power in a PLC circuit.
The last two configurations in Figure 3 are the only ones that will turn PL ON.
Figure 3 - Possible configurations of inputs and corresponding outputs
SMART GRID
An Overview Of Smart Power Grid
Abstract

Figure 1 - Tree limbs create a short circuit during a storm, typically resulting in a power outage
The present electric grids use the technology of1970’s. But with the advancement in various concepts of power generation, problems associated with power outages and thefts, and also due to increase in demand, we require a modernized grid to avail all the needs of customers even in the situations of hype, which can be called a “smart grid”.
The smart grid performs various functions such that it increases grid stability, reliability, efficiency and ultimately reduces line losses.
Also the smart grids are designed to allow the two-way processing of electricity from consumers that have distributed generation. Various technologies like sensing and measurement, usage of advanced components are to be used for successful functioning of the grid. In this paper, smart grid, its functions, technologies used in smart grids are discussed.
Introduction to Electric Grid
The electric grid generally refers to all or the smart grid, in a nutshell, is a way to transmit and distribute electricity by electronic means. The electric grid delivers electricity from points of generation to consumers. The electricity delivery network functions via two primary networks: the transmission system and the distribution system. The transmission systems deliver electricity from power plants to distribution substations, while distribution systems deliver electricity from distribution substations to consumers.
The grid also encompasses myriads of local area networks that use distributed energy resources to several loads and/or to meet specific application requirements for remote power, municipal or district power, premium power, and critical loads protection.
Introduction to Smart Grid
Smart grid lacks a standard definition, but enters on the use of advanced of technology to increase the reliability and efficiency of the grid, from transmission to distribution. The Smart Grid is a vision of a better electricity delivery infrastructure.
Smart Grid implementation dramatically increases the quantity, quality, connectivity, automation and Coordination between the suppliers, consumers and networks, and use of data available from advanced sensing, computing, and communications hardware and software.
In addition to being outdated, power plants and transmission lines are aging, meaning they have difficulty handling current electricity needs, while demand may not be reduced any time, but it can still be increasing continuously. One solution could be to add more power lines, but the aging system would still be overwhelmed.
So instead of a quick fix, a more reliable, permanent solution is needed. Perhaps the most fundamental aspect of transitioning to a smarter electricity system is the smart meter.
Why Modernization of Electric Grid is required?
The major driving forces to modernize current power grids can be divided in four, general categories:
- Increasing reliability, efficiency and safety of the power grid.
- Enabling decentralized power generation so homes can be both an energy client and supplier (provide consumers with interactive tool to manage energy usage).
- Flexibility of power consumption at the client’s side to allow supplier selection (enables distributed generation, solar, wind, and biomass).
- Increase GDP by creating more new, green collar energy jobs related to renewable energy industry manufacturing, plug-in electric vehicles, solar panel, and wind turbine generation, energy conservation and construction.
Smart grid delivery
Smart Grid Functions
The integrated system of the smart grid has two scopes.
One scope is transmission monitoring and reliability and includes the following capabilities:
- Real time monitoring of grid conditions.
- Improved automated diagnosis of grid disturbances, and better aids for the operators who must respond to grid problems.
- Automated responses to grid failure that will isolate disturbed zones and prevent or limit cascading blackouts that can spread over a wide area.
- “Plug and play” ability to connect new generating plants to the grid, reducing the need for the time consuming interconnection studies and physical upgrades.
- The automatic restoration of power would be accomplished by a combination of sensors, computer analysis and advanced substation components, as well as by the ability to reroute power to outage locations.
- Enhancing ability to manage large amounts of solar and wind power.
The second scope is consumer energy management:
- At a minimum, the ability to signal homeowners and businesses that power is expensive and/or tight in supply. This can be done, via special indicators or through web browsers or personal computer software. The expectation is that the customer will respond by reducing its power demand.
- The next level of implementation would allow the utility to automatically reduce the consumer’s electricity consumption when power is expensive or scarce. This would be managed through the link between the smart meters and customer’s equipment or appliances.
- The smart grid system would automatically detect distribution line failures, identify the specific failed equipment, and help determine the optimal plans for dispatching crews to restore service. The smart grid would automatically attempt to isolate failures to prevent local blackouts to spread over that area.
- The smart grid would make it easier to install distributed generation such as rooftop solar panels, and to allow “net metering”, a rate making approach that allows operators of distributed generators to sell surplus power to utilities. The smart grid would also manage the connection of millions of plug-in hybrid electric vehicles into the power system.
Hence the functions of smart grid can be summarized into the following terms as selfhealing, consumer participation, resist attack, high quality power accommodate generation options, enable electricity markets, optimize assets, enable high penetration of intermittent generation options.
Technology- Initial Focus
Smart Grids rely on information technology advancements across telecommunications and operations. Utilities apply these technologies both to grid operations – transmission and distribution wires and associated equipment and to the customer site-meters, customer owned energy technology equipment and appliances, and home area networks (HANs).
Wires
High temperature superconductor (HTS) wire enables power transmission and distribution cables with three to five times the capacity of conventional underground AC cables and up to ten times the capacity of DC cables. Fault current management capability when using Fault Blocker cable systems.
Wires-focused Smart Grid projects commonly involve:
- One of the components to smart grid would be the replacement of the aging power lines withhigh-temperature superconducting lines.
- The new wires could be installed underground to avoid cluttering up the already congested cityscapes.
- New telecommunications and operational (sense and control) technologies: These improve delivery performance and resilience.
- New sensor and control technologies. These, when combined with distributed intelligence, make it possible to report and resolve grid issues in real time (self healing).
- Transmission and distribution intelligent electronic devices. These alert operators, automatically respond to problems, and integrate generation from renewable resources.
Sensing and Measurement
Smart Grid - Advanced Metering Infrastructure (AMI)
Core duties are evaluating congestion and grid stability, monitoring equipment health, energy theft prevention, and control strategies support. Technologies include smart meters, sensing systems, advanced switches and cables, digital protective relays etc… In all these, smart meters play a vital role.
In Smart Metering, an Advanced Metering Infrastructure (AMI) of interval meters and two-way communications systems serves as a gateway for utility/customer interaction. Smart Metering has the potential to reduce both customer and utility costs.
If you take a look at your current electricity meter, you will see that it is very mechanical, humming along blindly, waiting to be read by a technician, to determine the amount of electricity used in a given month, at the end of which you receive a bill. A smart meter utilizes what is known as real-time monitoring (RTM). A display lets the consumer know how much electricity is used and even when it is less expensive to use it.
“Studies have shown that when people are made aware of how much power they are using, they reduce their use by about 7%.” A smart grid also prevents the entire system from becoming overloaded, lessening the chance for a power outage.
Advanced Components
Innovations in superconductivity, fault tolerance, storage, power electronics, and diagnostics components are changing fundamental abilities and characteristics of grids.
Technologies within these broad R&D categories include: flexible alternating current transmission system devices, high voltage direct current, first and second generation superconducting wire, high temperature superconducting cable, distributed energy generation and storage devices, composite conductors, and “intelligent” appliances.
Renewable Energy and the Smart Grid
Renewable Energy and the Smart Grid
The smart grid can be seen as an alternative energy source, certainly a change from the current way of doing things. In addition to rerouting electricity, the smart grid would be able to fill in the gaps of these alternative energy power sources. One way this could be accomplished, surprisingly enough, is with another alternative energy technology – the electric car, specifically, the plug-in electric hybrid (PHEV).
This would work through the concept of energy storage, in the case of the PHEV, specifically referred to as V2G or vehicle to grid. This use of alternative energy sources, like wind and solar reduces the nation’s dependence on foreign oil and helps keep pollution from car exhaust and power plants to a minimum.
Other Technologies
Integrated communications will allow for real-time control, information and data exchange to optimize system reliability, asset utilization, and security.
Conclusion
The major source of energy for human beings is electricity. Without electricity, no technology or science could have been possibly developed. But there are many problems associated with effective functioning of the electric grids which cause a serious loss of power and may even create severe scarcity in future. Also, the latest advancements in generation of electricity from renewable sources also require a means for effective utilization.
So, keeping in view of these, for better performance of the grid, smart grids should be developed all over the world So that we have a more transparent, reliable system that allows consumers to save money and utility companies to more accurately control electricity.
Thus Smart Grid technology paves way for increased utilization of green power.
Subscribe to:
Posts (Atom)